Graph Types
CPlot supports two major types of charts. These are image plots, and X-Y plots. Examples of these charts are shown below.
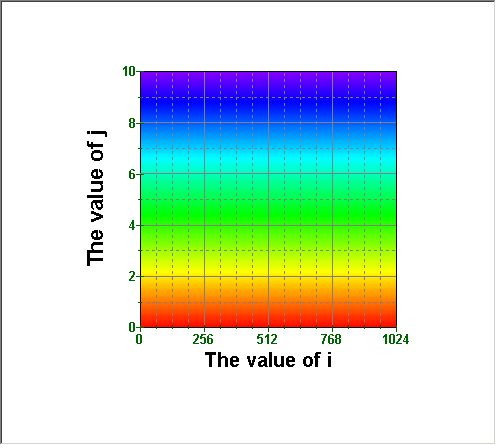
Image charts
Image charts plot two-dimensional data (an X by Y array) on the screen using color tables in order to define how the colors are displayed. CPlot comes with a variety of color tables. The one shown in the image below is the Rainbow color table.
Features of image charts
- Dynamically scales to window content
- Can stretch to fit window (and optionally maintain the aspect ratio)
- Built-in color tables
- Four axis support (left, bottom, right, top)
- Automatic ranging and tick count determination
- Major and minor grid lines
- Built in shortcut (contextual/popup) menu support
- Built in settings dialogs
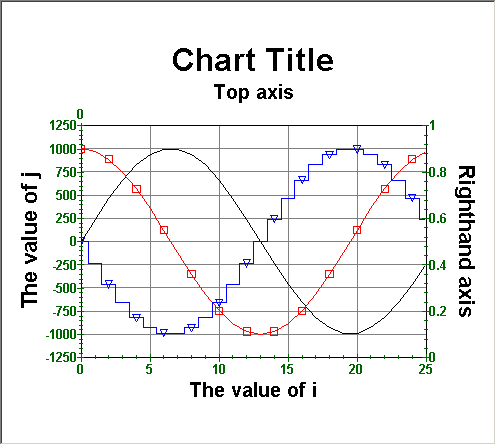
XY charts
XY Charts plot X vs. Y data (a series of independent variables plotted against a series of dependent variables.) These charts can handle up to 10 data sets simultaneously, and support a variety of plotting types, marker types (and frequencies) and line widths, independent for each data set. The chart below shows examples of two chart types.
Features of XY charts
- Dynamically scales to window content
- Support for XY scatter, XY connect (line), and histogram graphs
- Support for several different marker shapes, and allowing to plot a marker every 10 data points, or a total of 10 markers (for example)
- Each data set supports its own color
- Four axis support (left, bottom, right, top)
- Automatic ranging and tick count determination
- Major and minor grid lines
- Built in shortcut (contextual/popup) menu support
- Built in settings dialogs