void CTestProjectView::OnDraw(CDC* pDC)
{
	CRect		clientRect;
	int			nOldMode;

	nOldMode = pDC->GetMapMode();

	GetClientRect( clientRect );

	nOldMode = pDC->SetMapMode( MM_LOMETRIC );

	pDC->DPtoLP( (LPPOINT) &clientRect, 2 );

	m_Chart.OnDraw( pDC, clientRect );

	pDC->SetMapMode( nOldMode );
}
If everything goes well, you should now be able to build and run your project (remember, if you haven't done a full rebuild since adding the resources, do so now.) When you run it, you should get a window that looks something like the following:
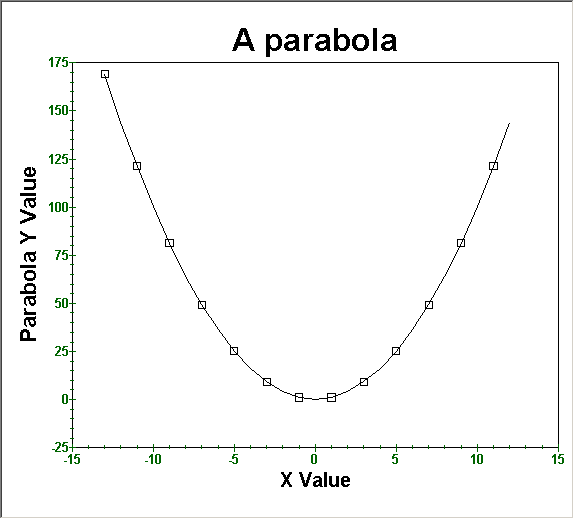
Note that the X and Y ranges were automatically set by CPlot. We didn't even need to do anything with them! And the markers are there, just as requested. And the titles. Cool. In many cases, that's all you'll ever have to do. But printing is also really easy with CPlot, as is obtaining contextual menu support.